
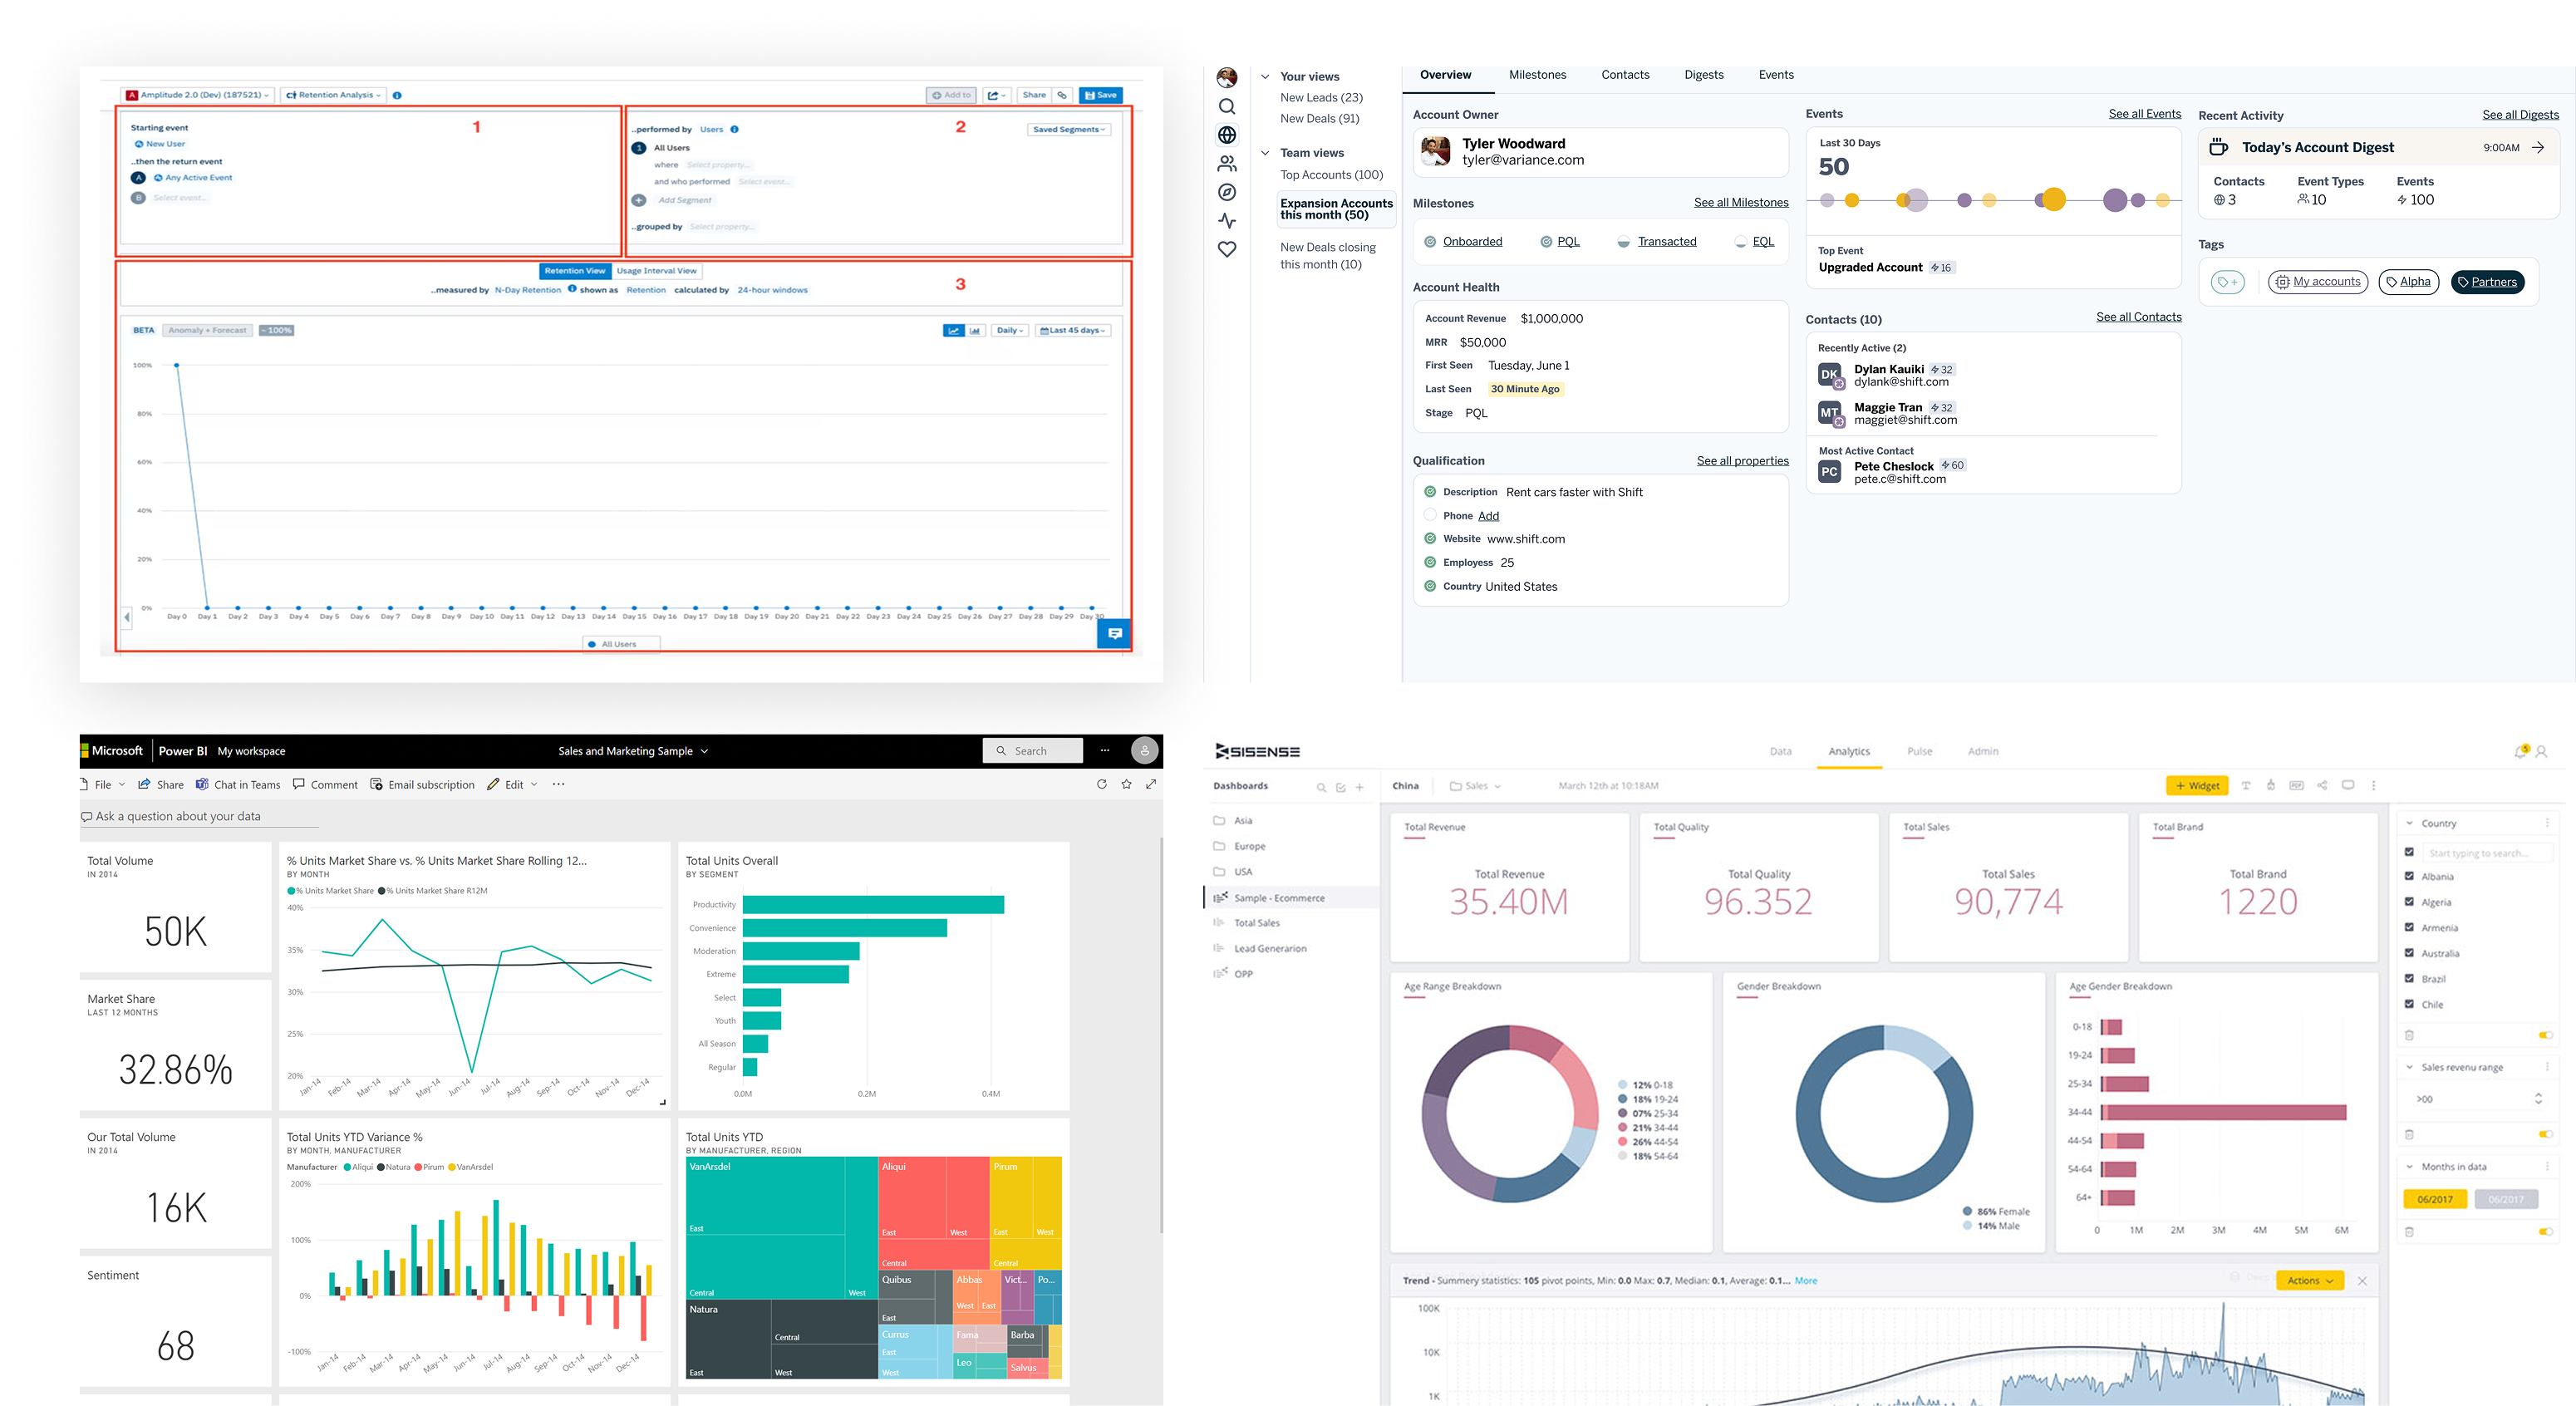
Enterprise software companies building customer-facing data products often struggle with significant technical complexity and infrastructure overhead. Technical stakeholders typically lack visibility into user activity, preferring to focus on writing business logic rather than managing pipelines or optimizing databases. At the same time, non-technical stakeholders can’t interpret user behavior patterns, creating dangerous blind spots in product strategy and customer success efforts. They often relying on BI dashboards or integrations with SaaS platforms like Salesforce or HubSpot.
When I joined the Patch team, stakeholders presented me with a clear directive: "Users need better event notifications for their data pipelines." The engineering team was eager to build sophisticated trigger boards, and early customer conversations seemed to support this direction. Other problems considered were:
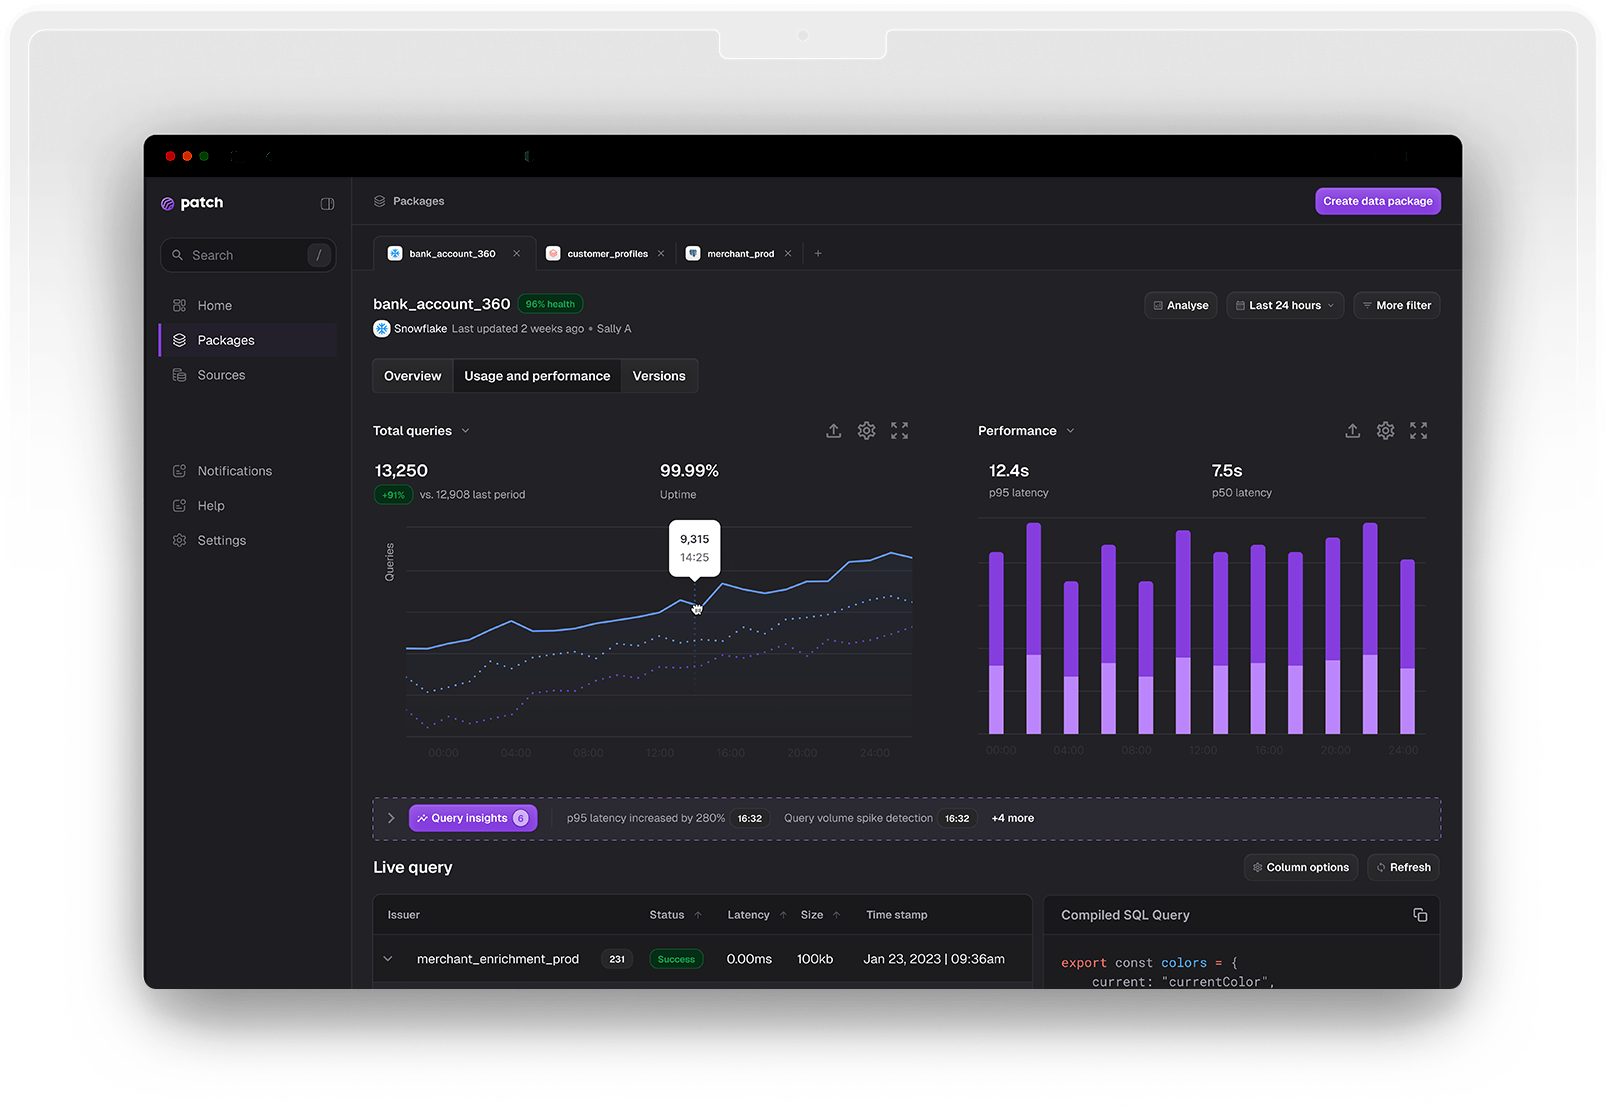
- Engineers had limited visibility into how end users interacted with data pipelines.
- PMs and sales relied on indirect or delayed insights from BI tools or CRM integrations. This slowed down decision-making, and increased reliance on ad-hoc support from technical teams
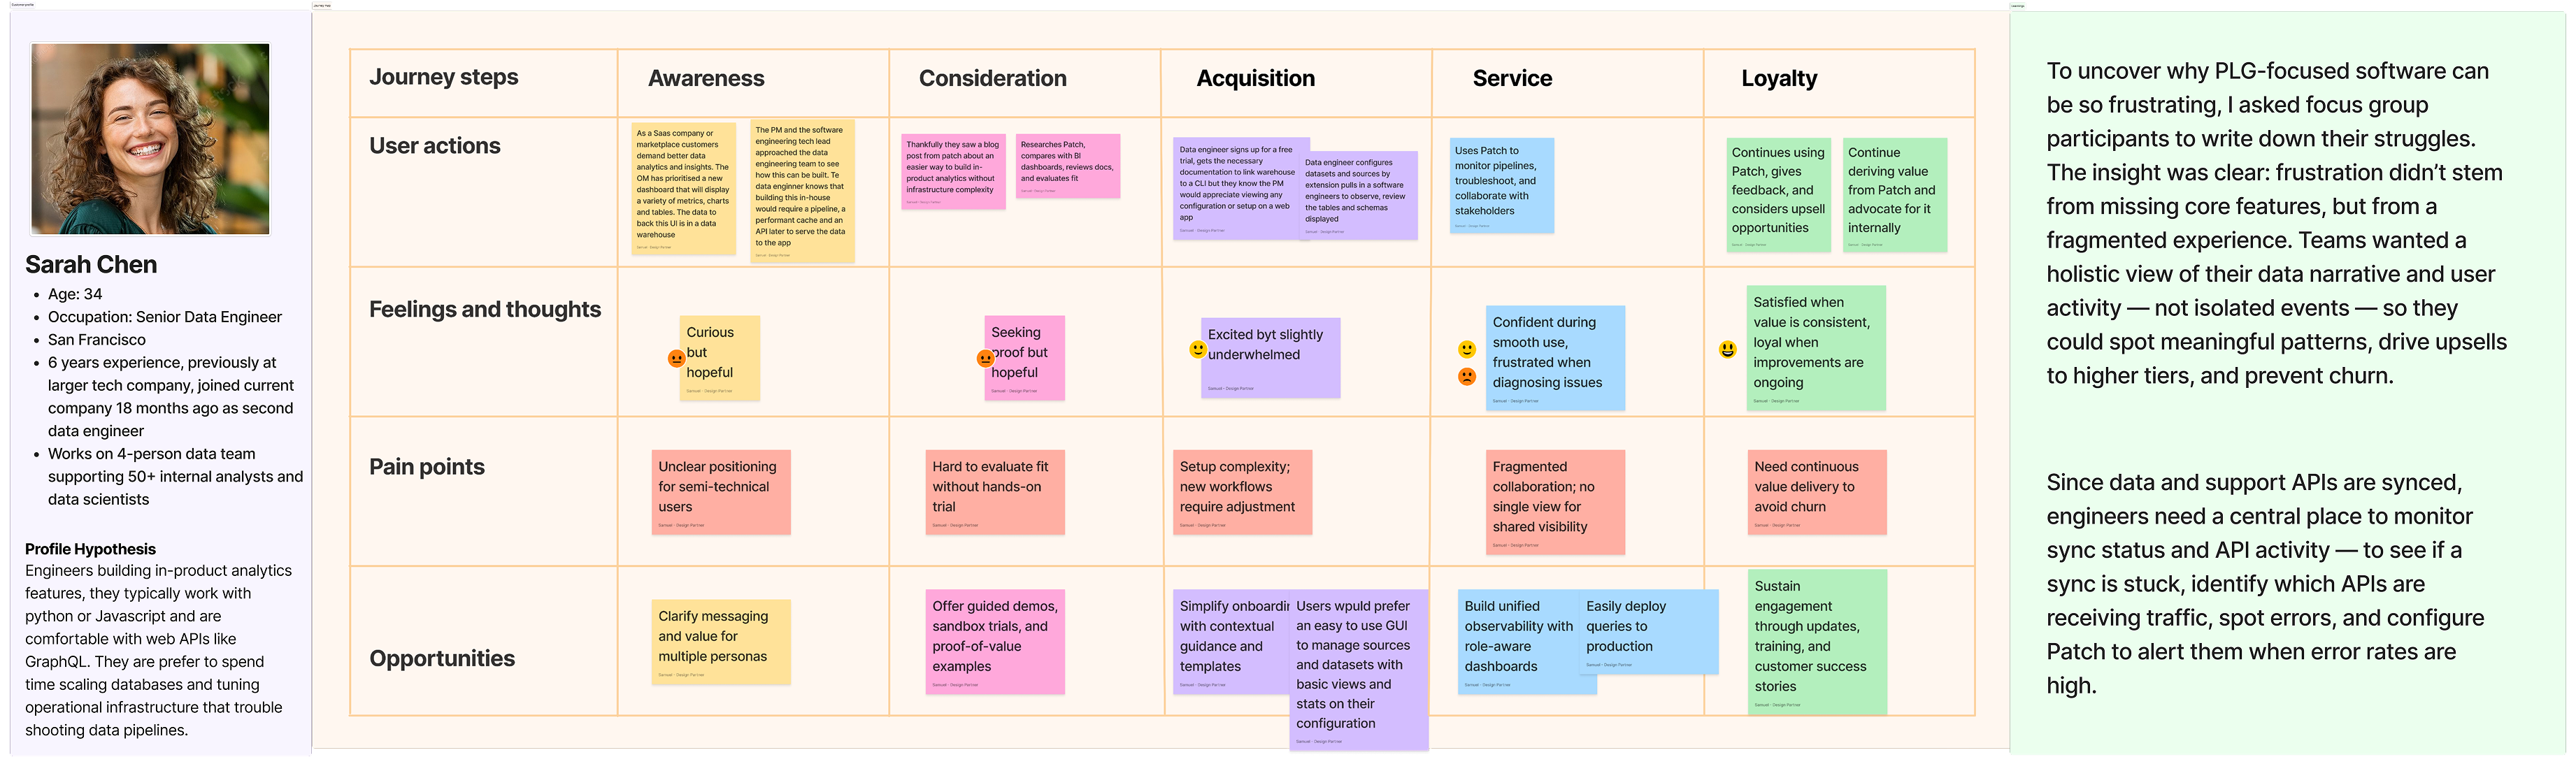
Rather than proceeding and building based on our hypothesis I took ownership of clarifying the actual problem space through research. This required buy-in from engineering leadership to delay development while we gathered definitive insights. I committed to observing actual user behaviour across three distinct personas:
Data Engineers
Software Engineers
Product Managers/Account Executives
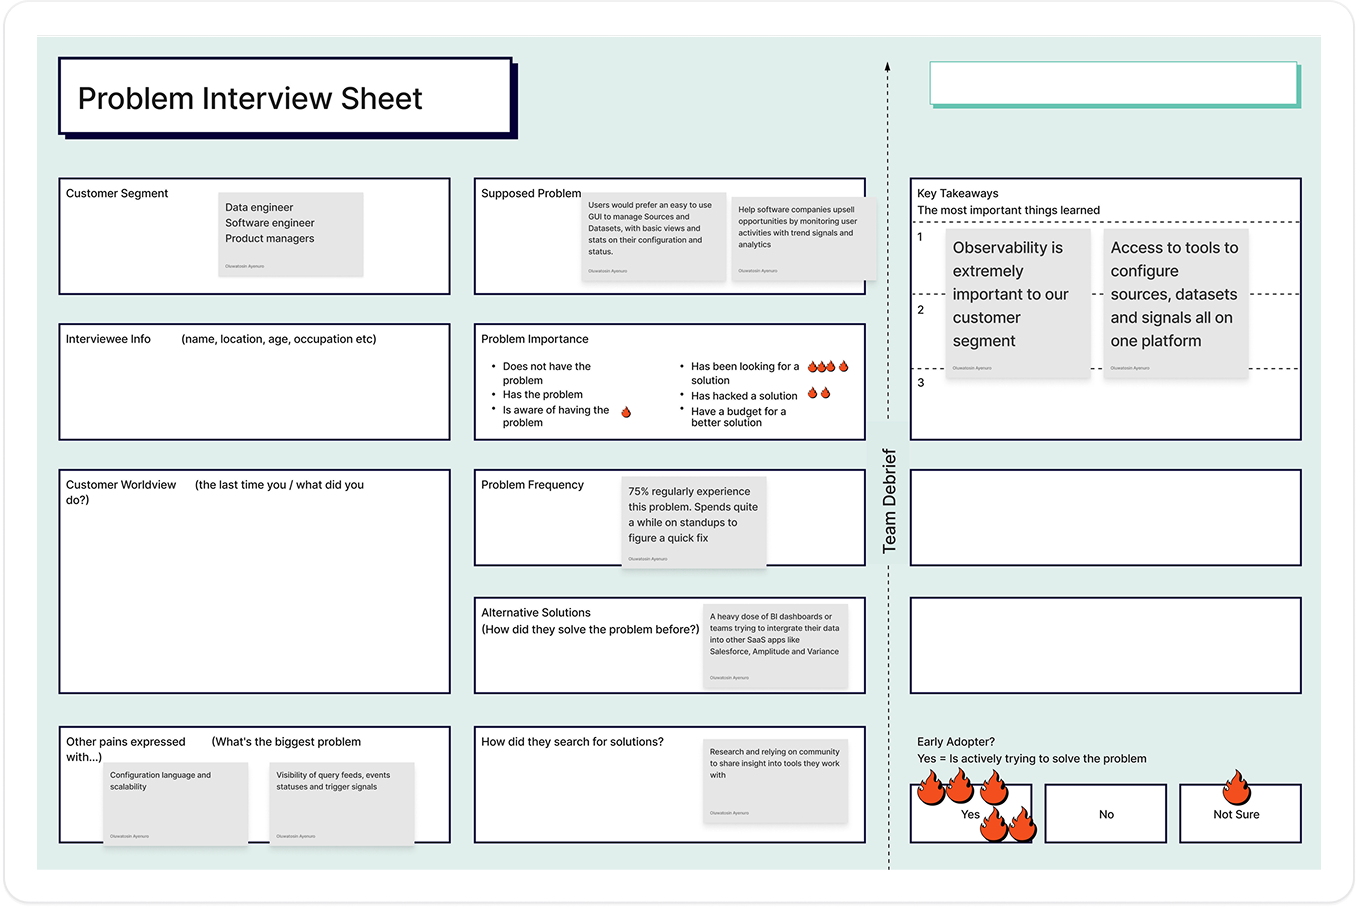
Critical Insights: The Gap Between Assumptions and Reality
These insights directly contradicted stakeholder assumptions about trigger boards being the primary need. Instead, users were asking for consolidated observability that would eliminate tool-switching and enable cross-functional collaboration.
How might we help self-serve software companies upsell opportunities or potential churn using usage and performance.
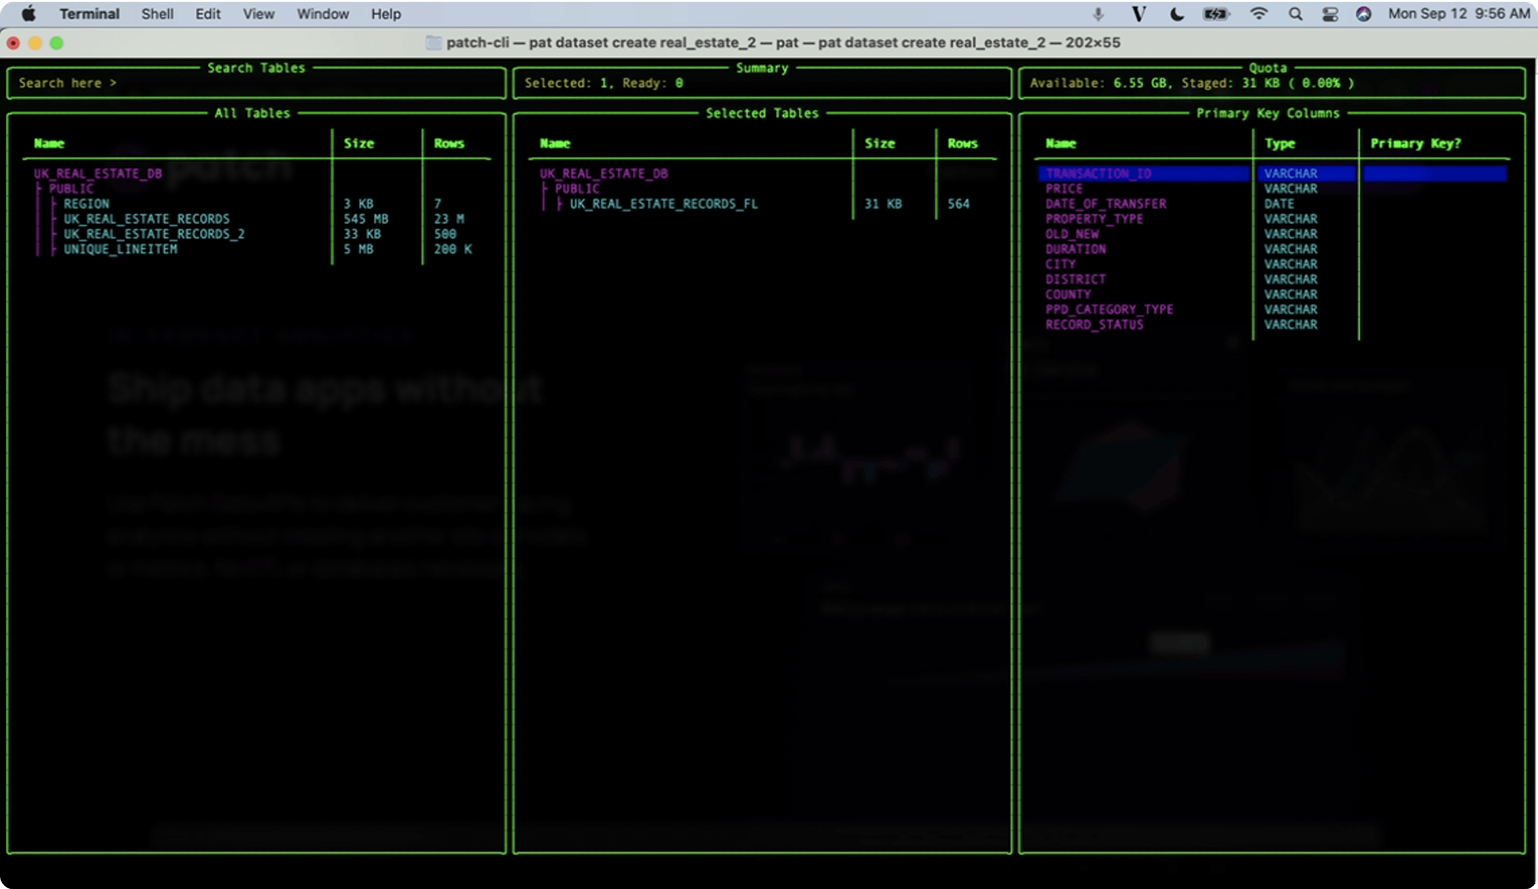
How do we help them manage their warehouse sources and datasets with basic signals, stats on their configurations and events.
How do I get stakeholder buy in for this new direction?
To validate whether comprehensive observability would truly address user needs better than trigger boards, I had a follow-up research flow that traced the complete problem-solving journey users experienced when pipeline issues occurred.
I asked 10 of high-flame users (🔥🔥🔥🔥🔥from focus groups) to walk me through their most recent pipeline troubleshooting experience, focusing on. Using think-aloud protocol and observational cues. I kept track of their pain point.
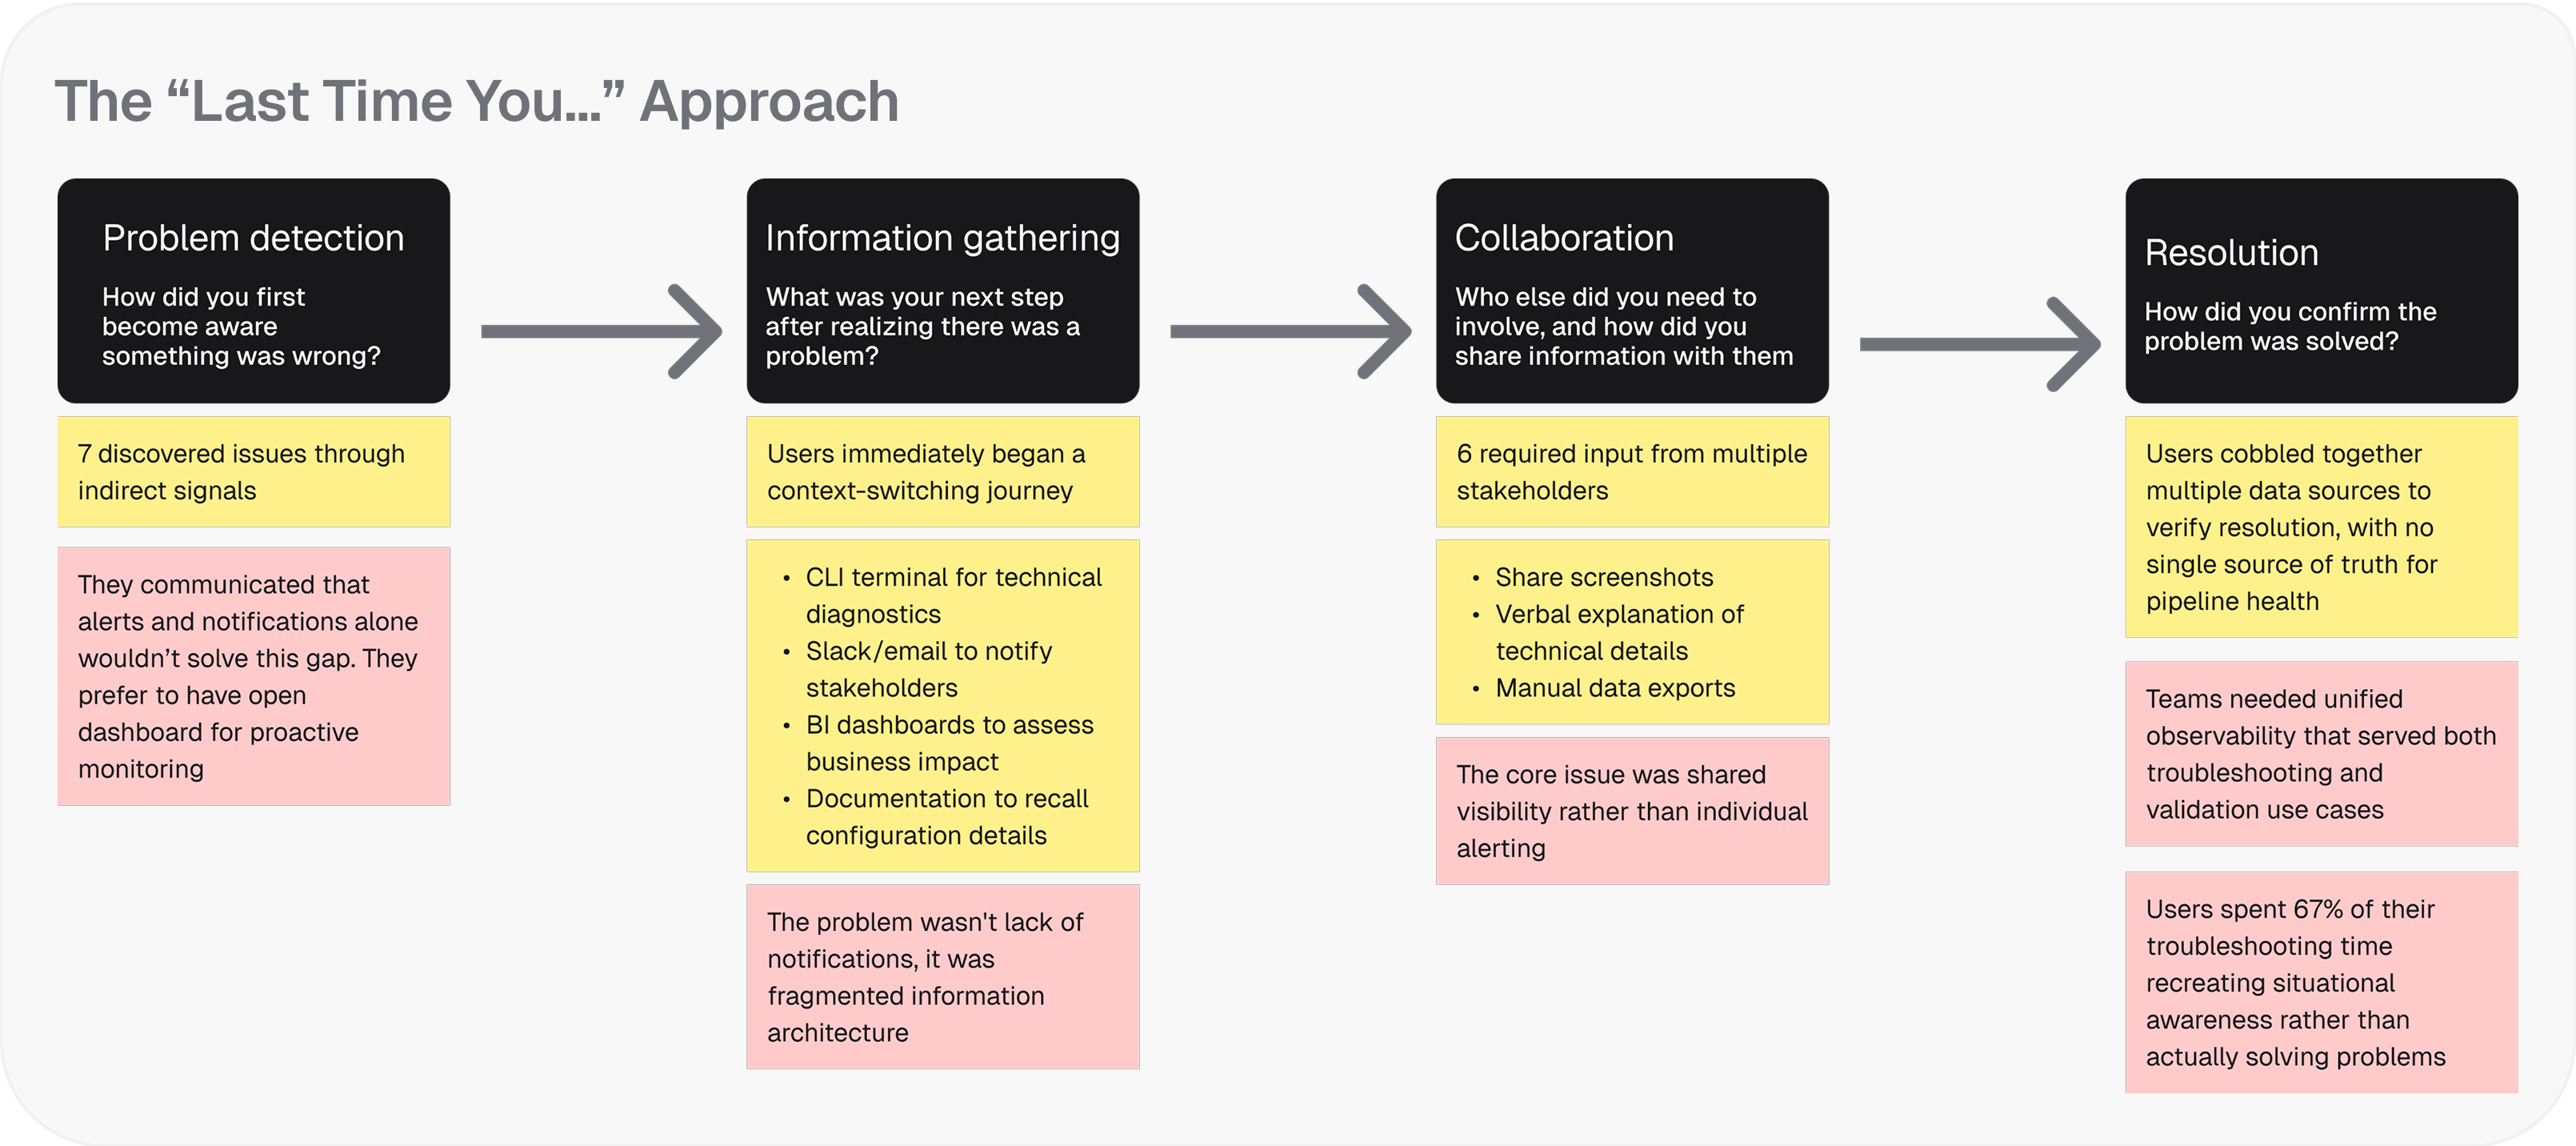
Our trigger board hypothesis crumbled when we observed what happened after teams received alerts. Users would get notified about an issue, then immediately fall into the same fragmented investigation process we'd already documented. The alert was just the starting point of a much deeper problem. This lead to me mapping out what our user journey would be with Patch solving these pain point.
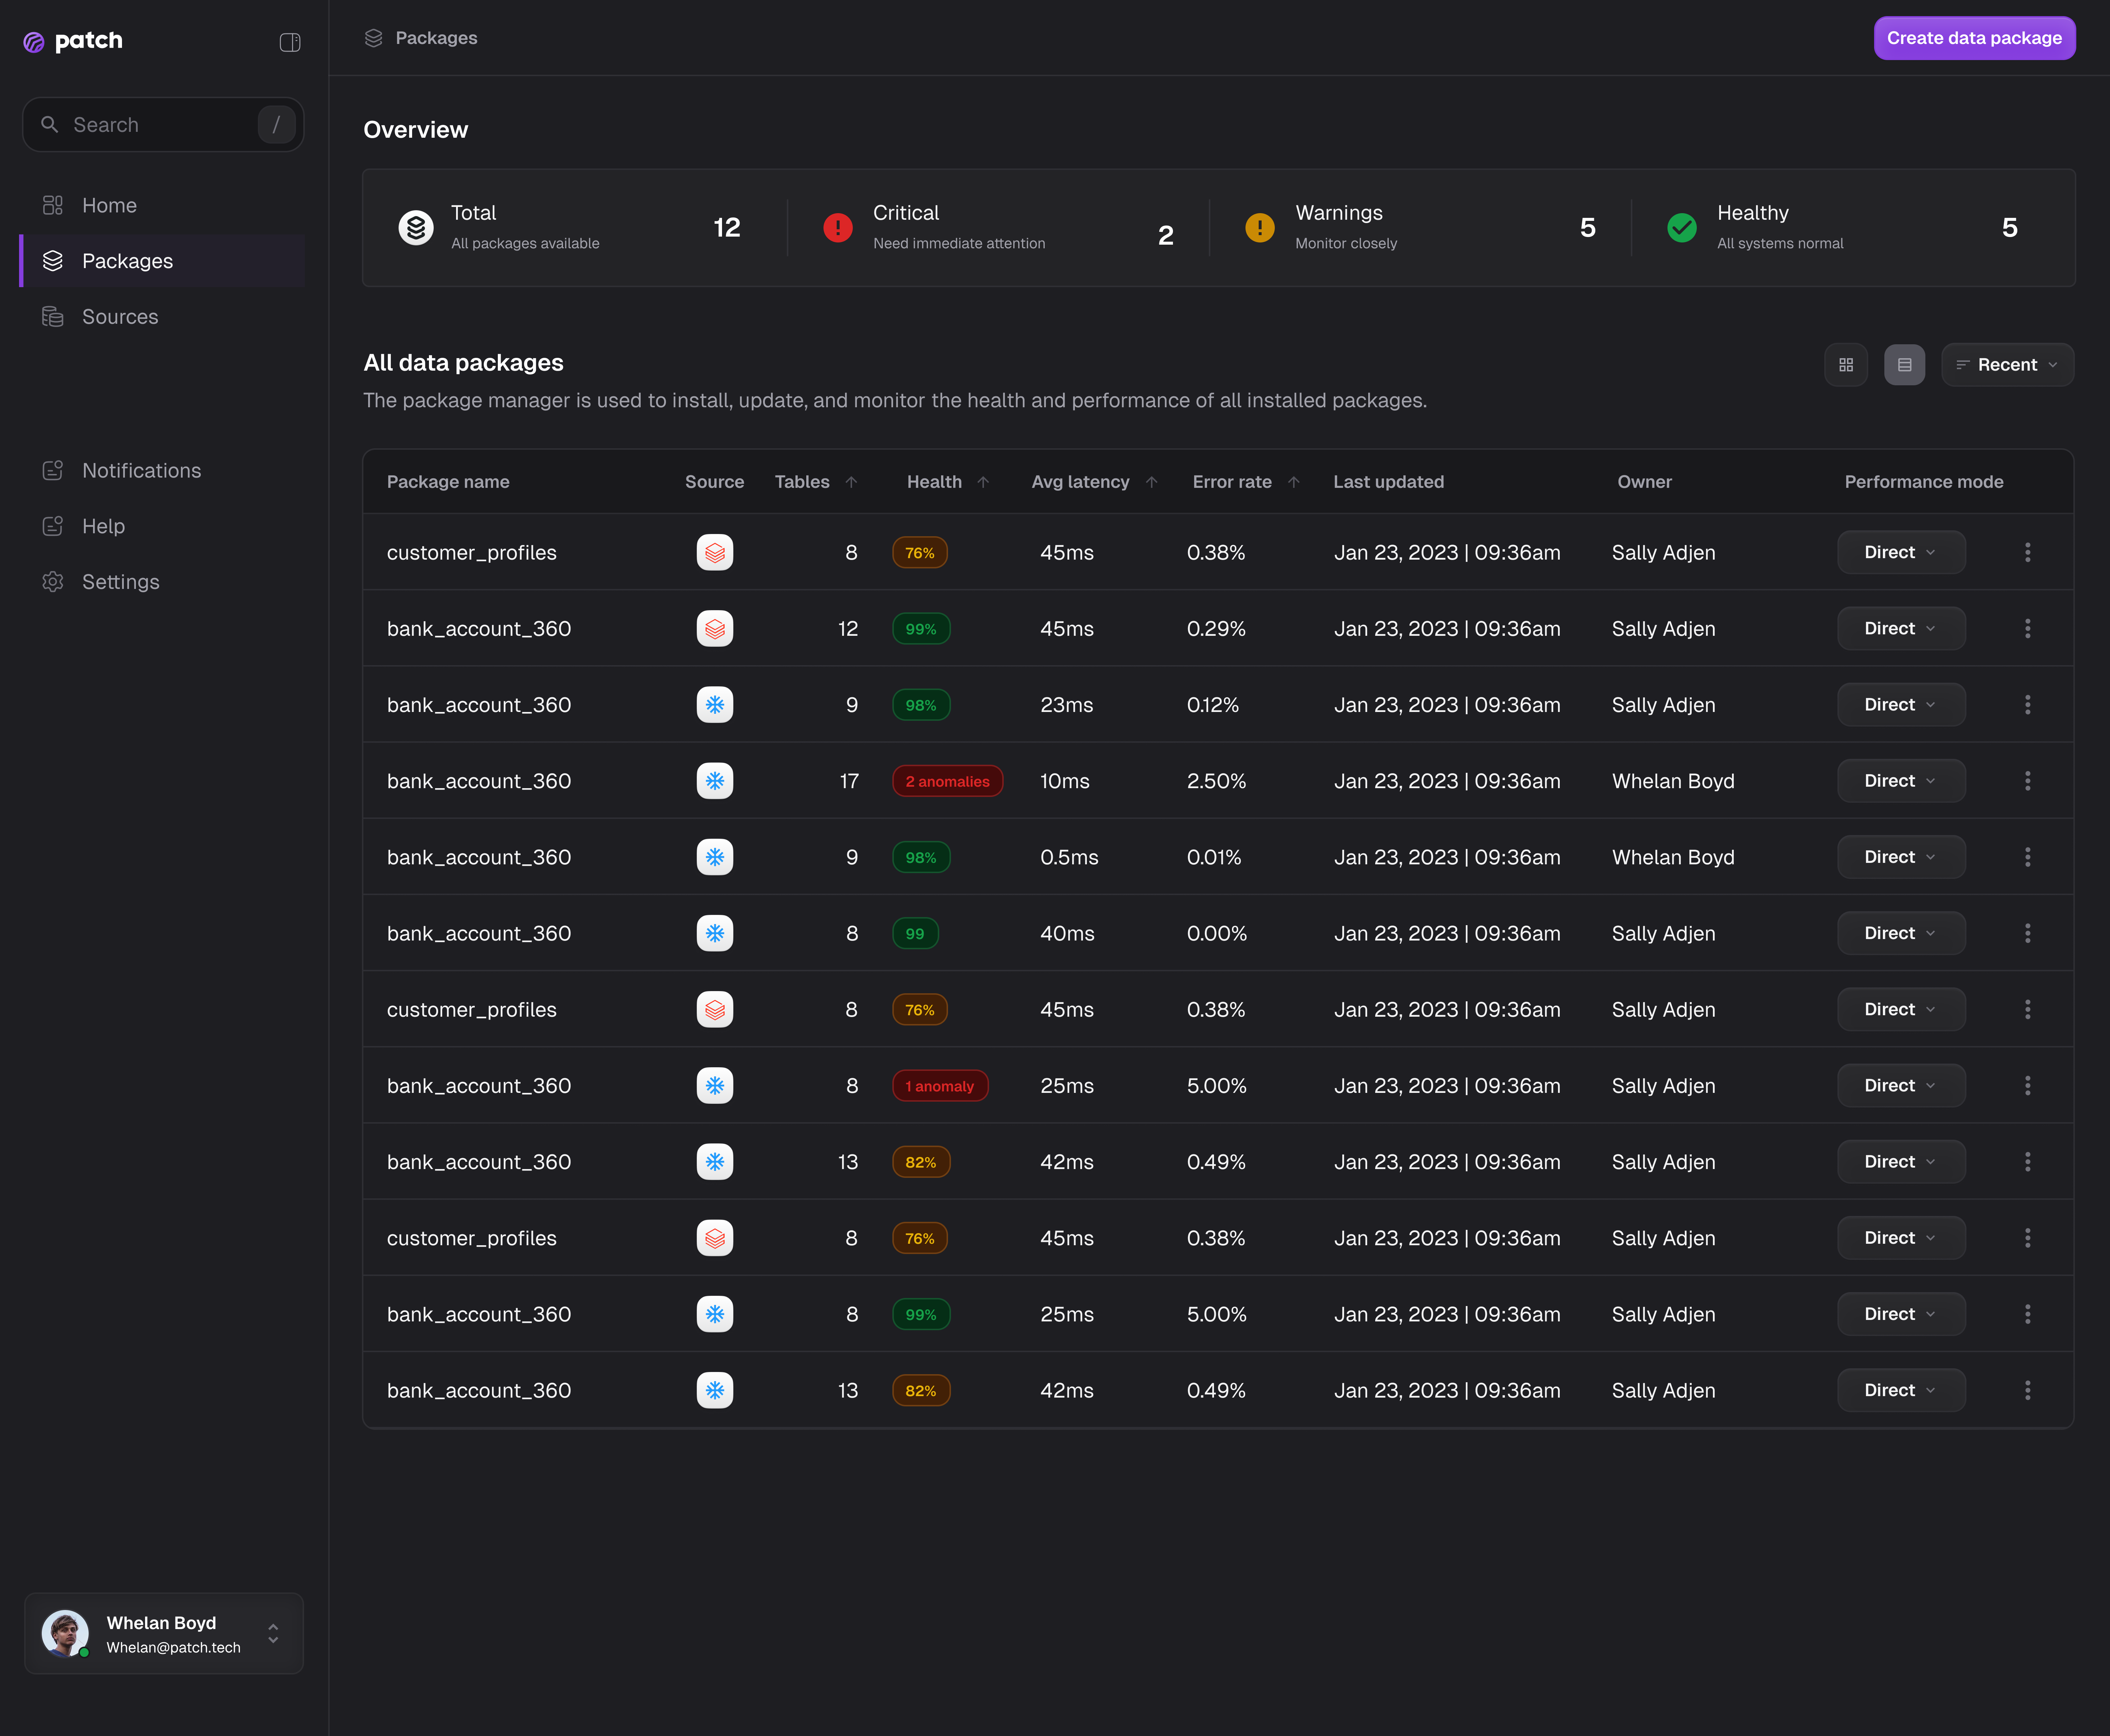
Comprehensive Observability addressed:
1. Unified information architecture (eliminating 40% of context-switching time)
2. Cross-functional self-service capabilities (reducing stakeholder coordination overhead by 50%)
3. Historical context preservation (enabling pattern recognition and proactive optimization)
4. Shared vocabulary and visual language across technical and business teams
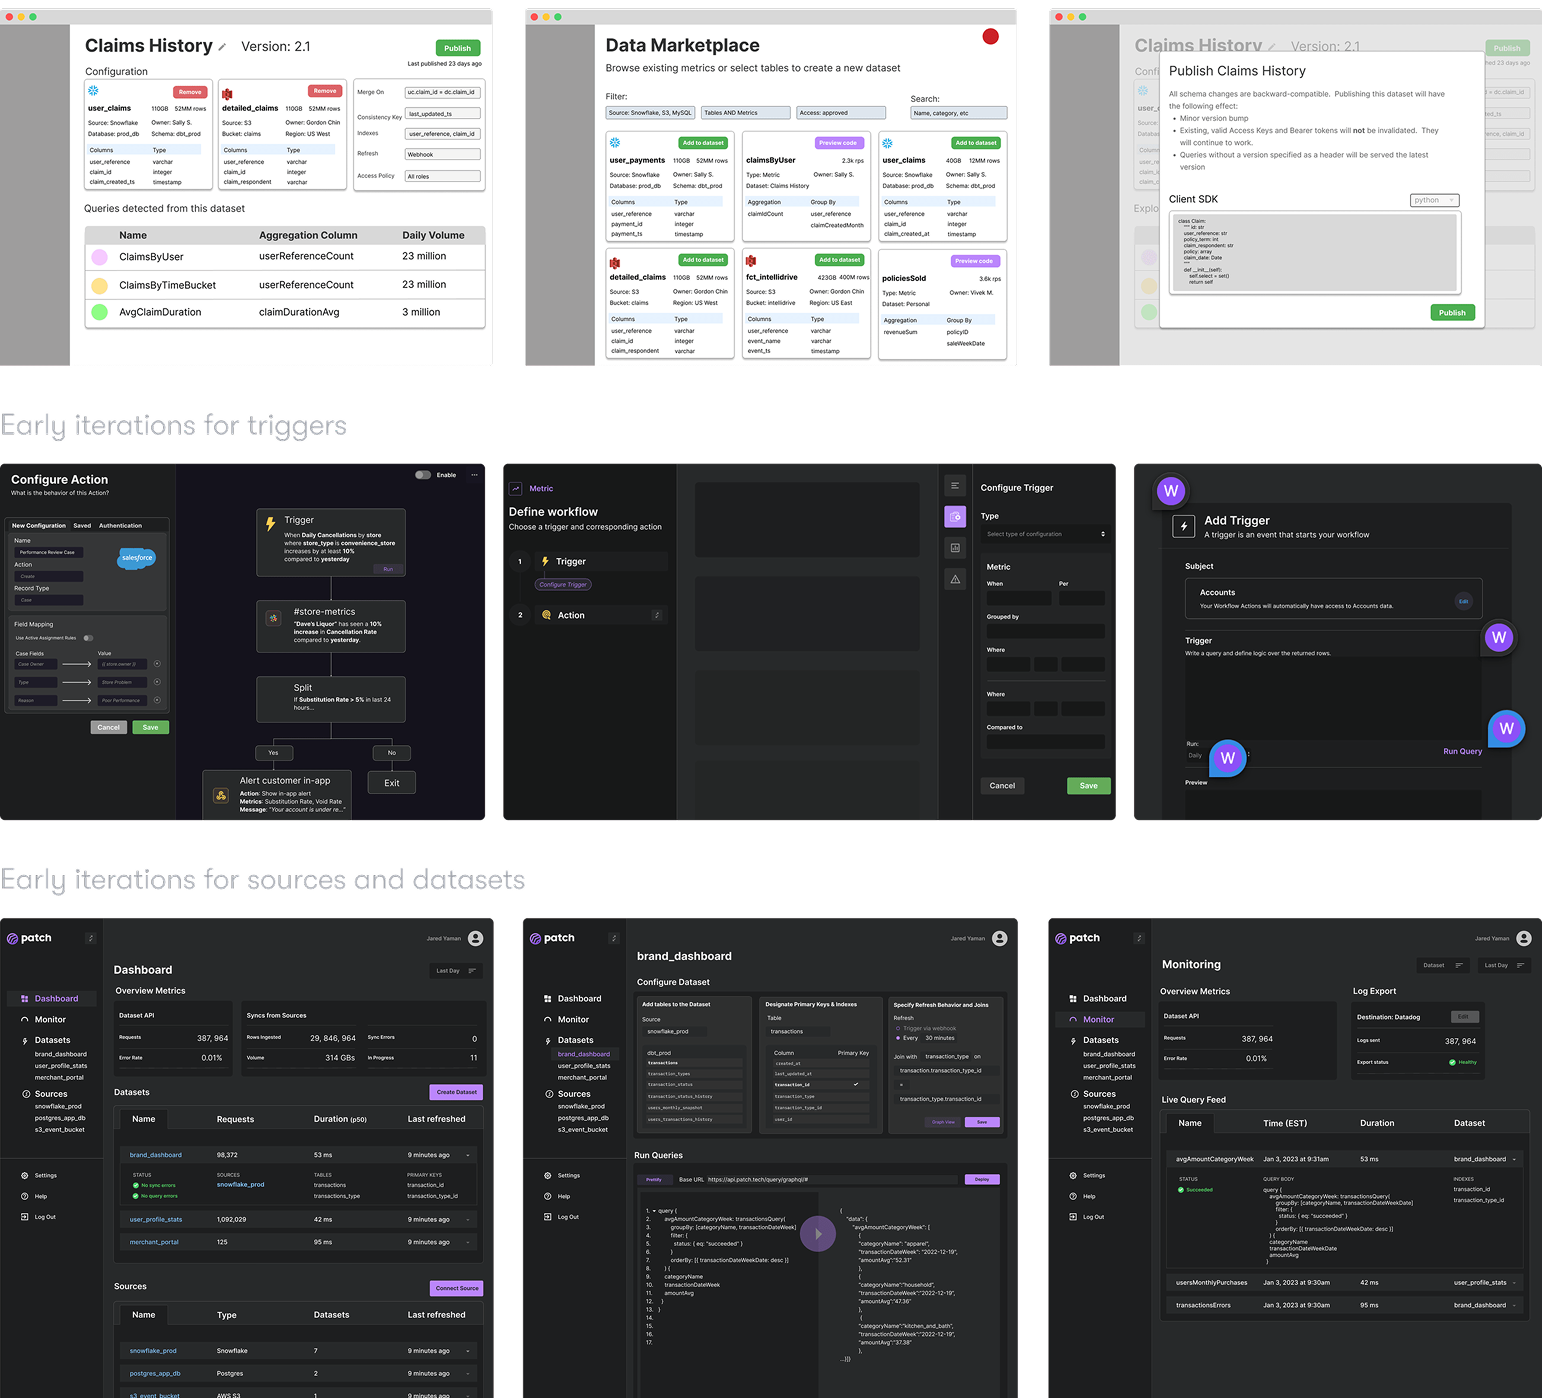
To accommodate an evolving design for what it is possible to achieve, I had to start by comparing the propositions of other products in the market. I wanted to leverage the mental model my ideal user has created for themselves based on their experience with these products creatively. To build with scalability in mind, I also explored how my users work with difference data schemas. I then decided to reduce clutter and help them put the puzzle together and empower users with capabilities they always hoped for
With the above analysis, it is evident that critical friction points extended far beyond the initial alert notification. So instead of focusing on building trigger boards, I led the team towards a more simple solution that focused on observability gap
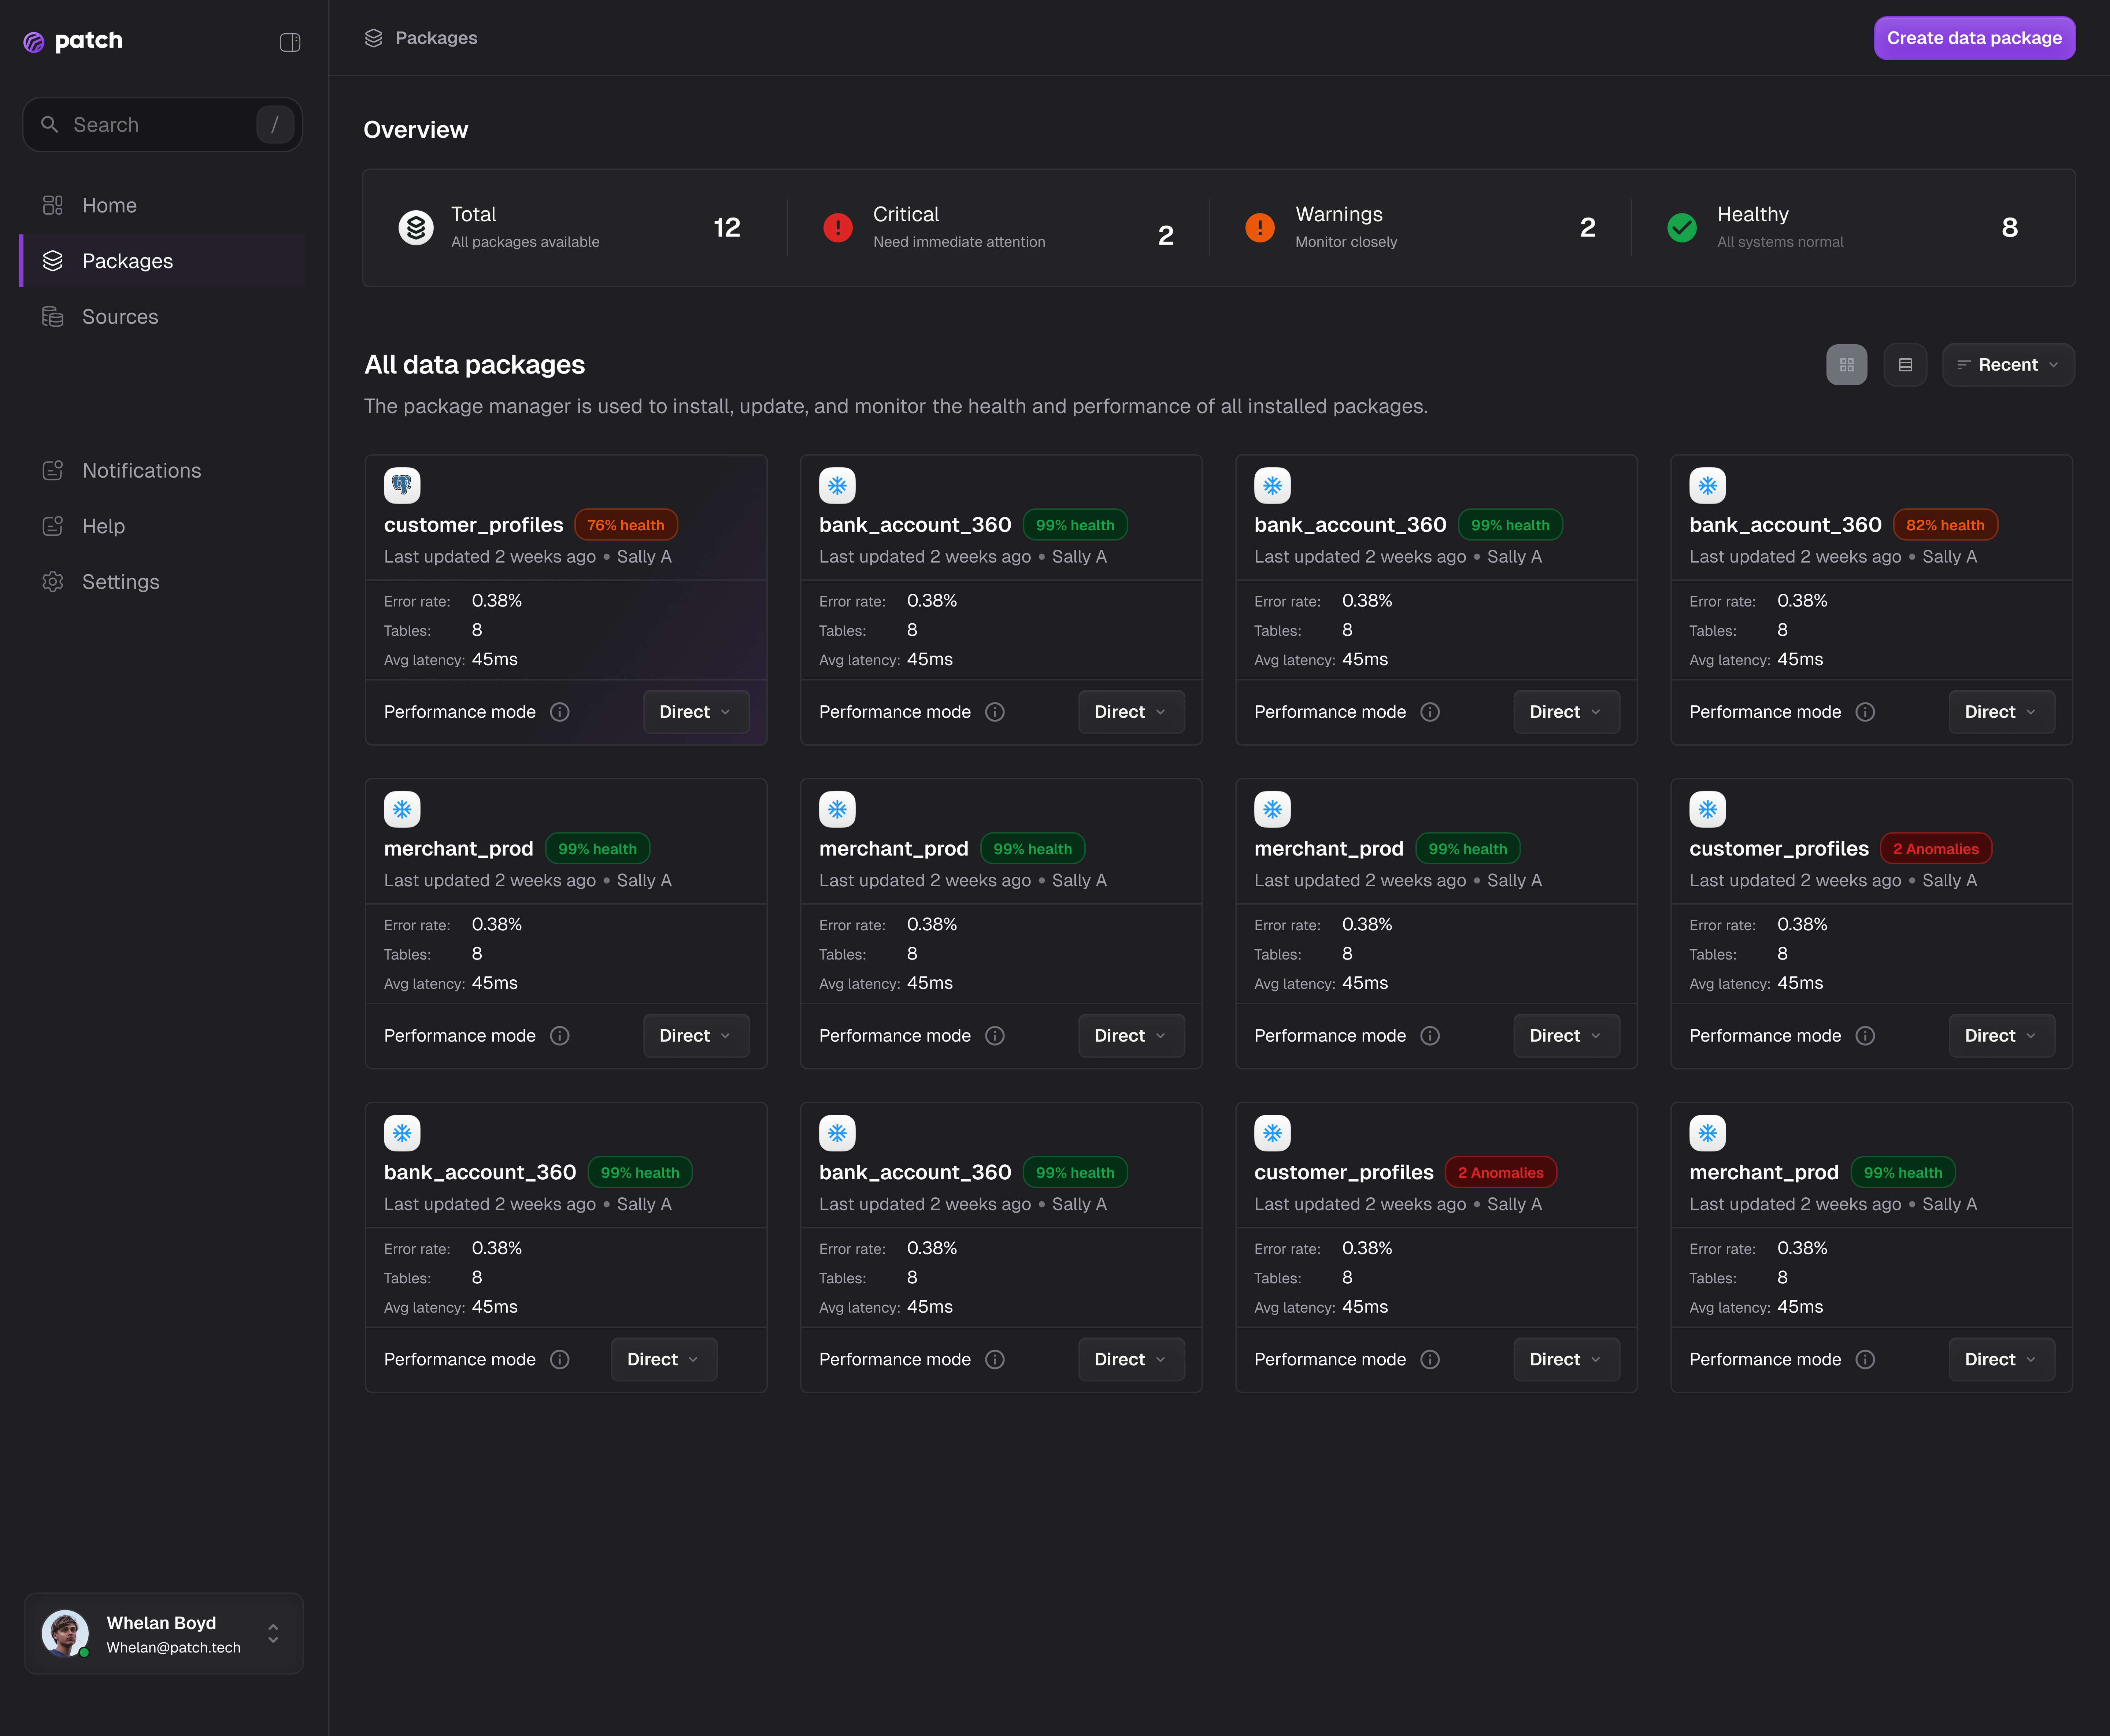
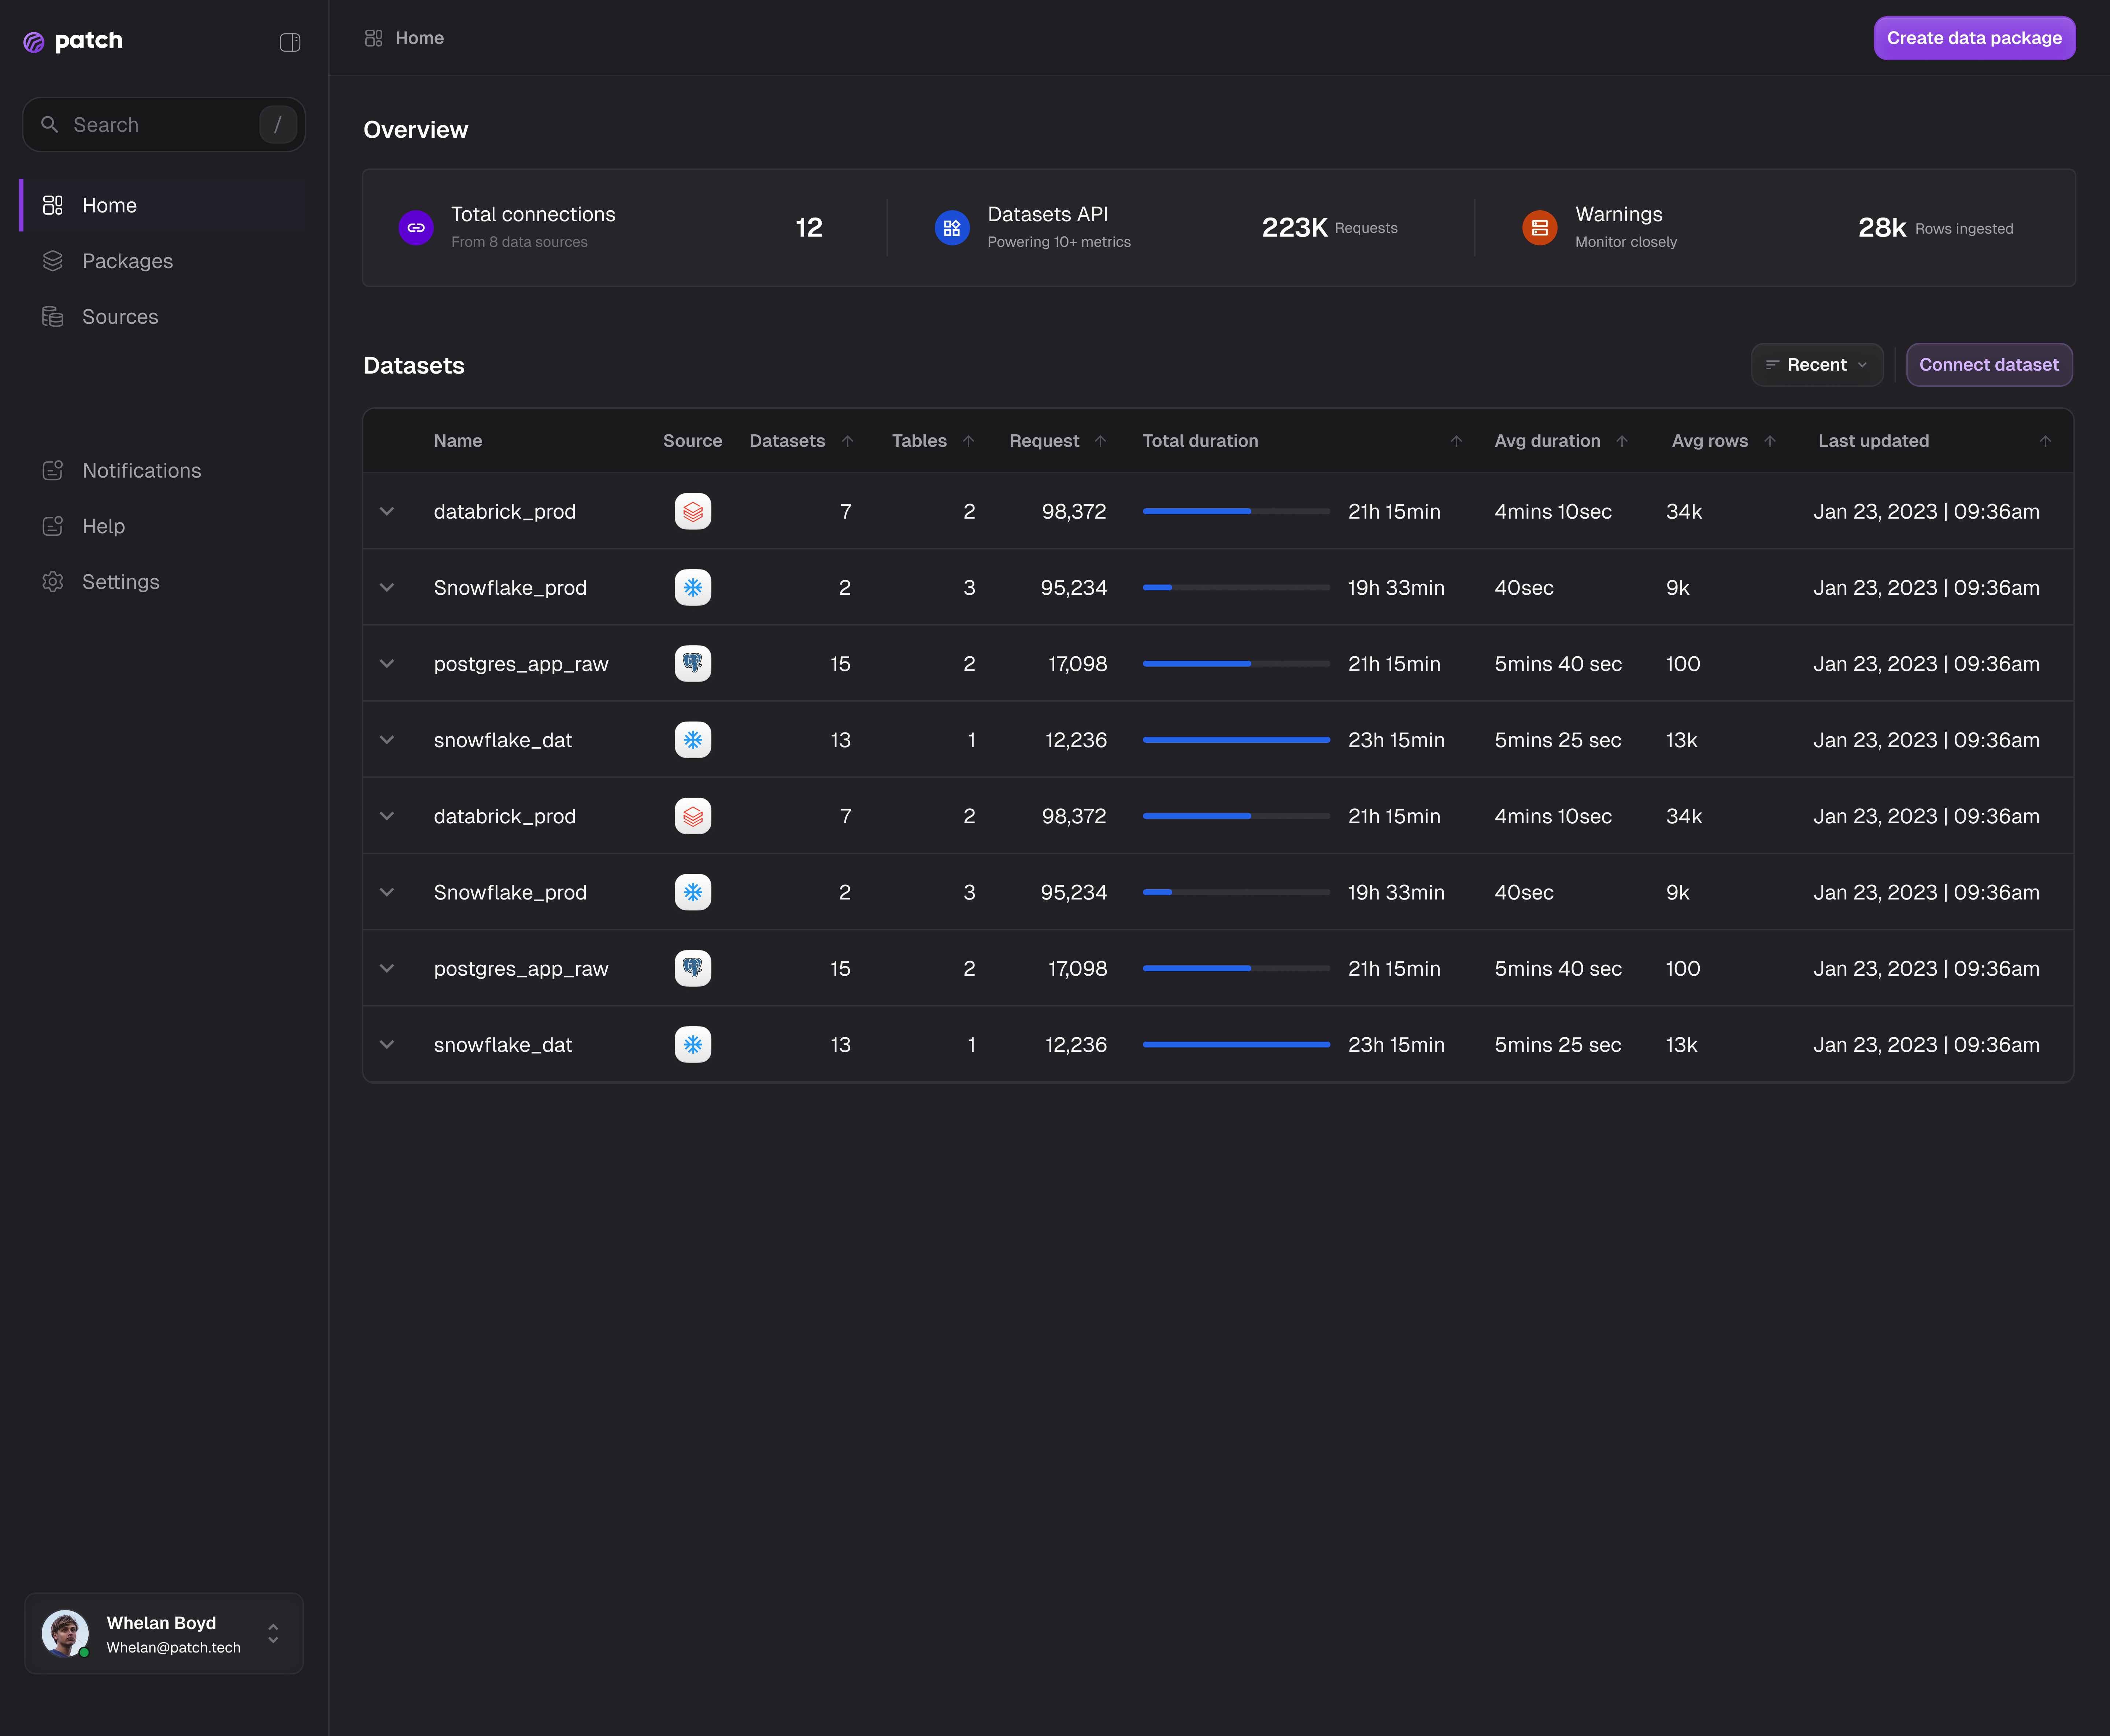
Using insights from research and feedback gathered during wireframing, I created high-fidelity designs that simplified user interactions by focusing on:
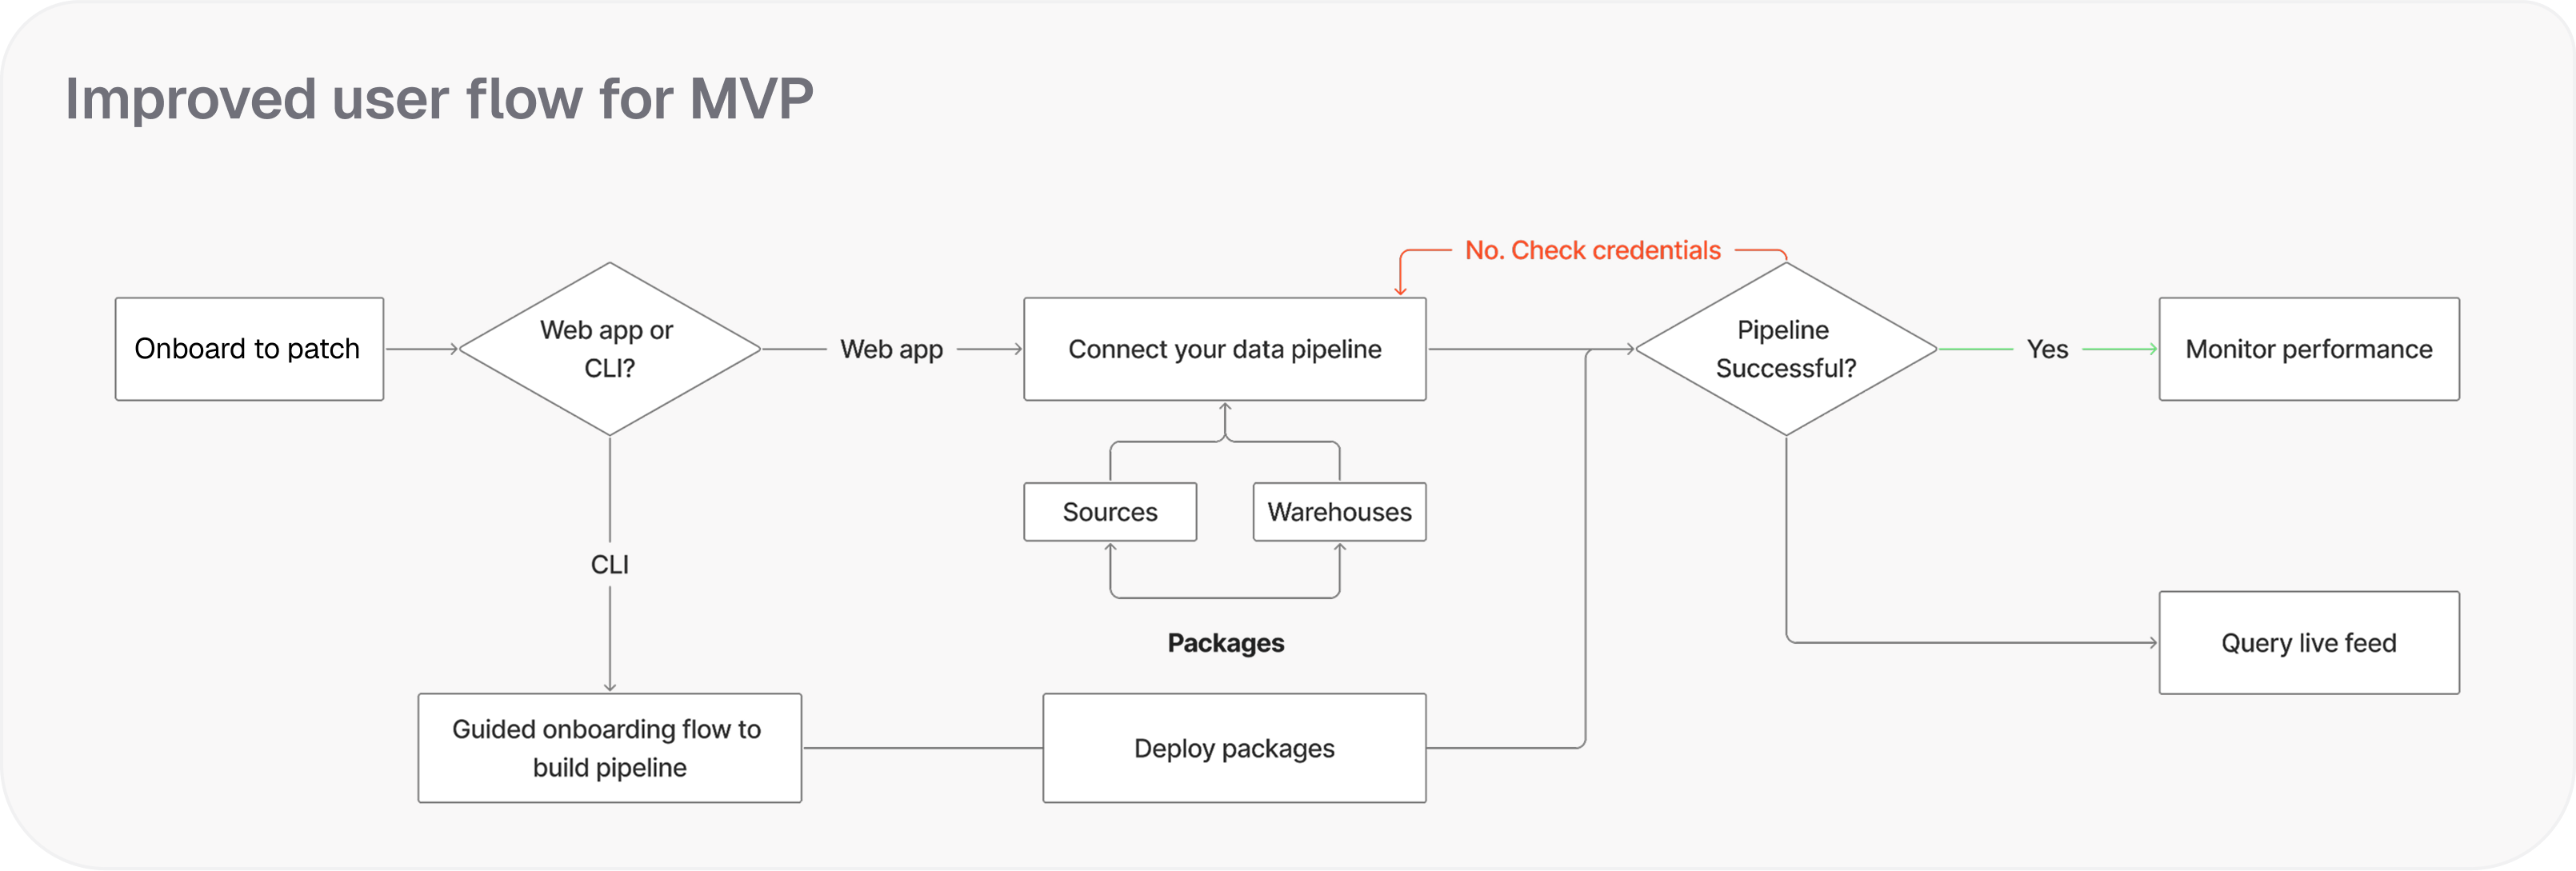
With the above analysis, it is evident that critical friction points extended far beyond the initial alert notification. So instead of focusing on building trigger boards, I led the team towards a more simple solution that focused on observability gap.
67% reduction in average time-to-diagnosis across cross-functional teams
42% decrease in engineering interruptions for status updates
4.2/5 usability score for v2 compared to v1 and CLI alone
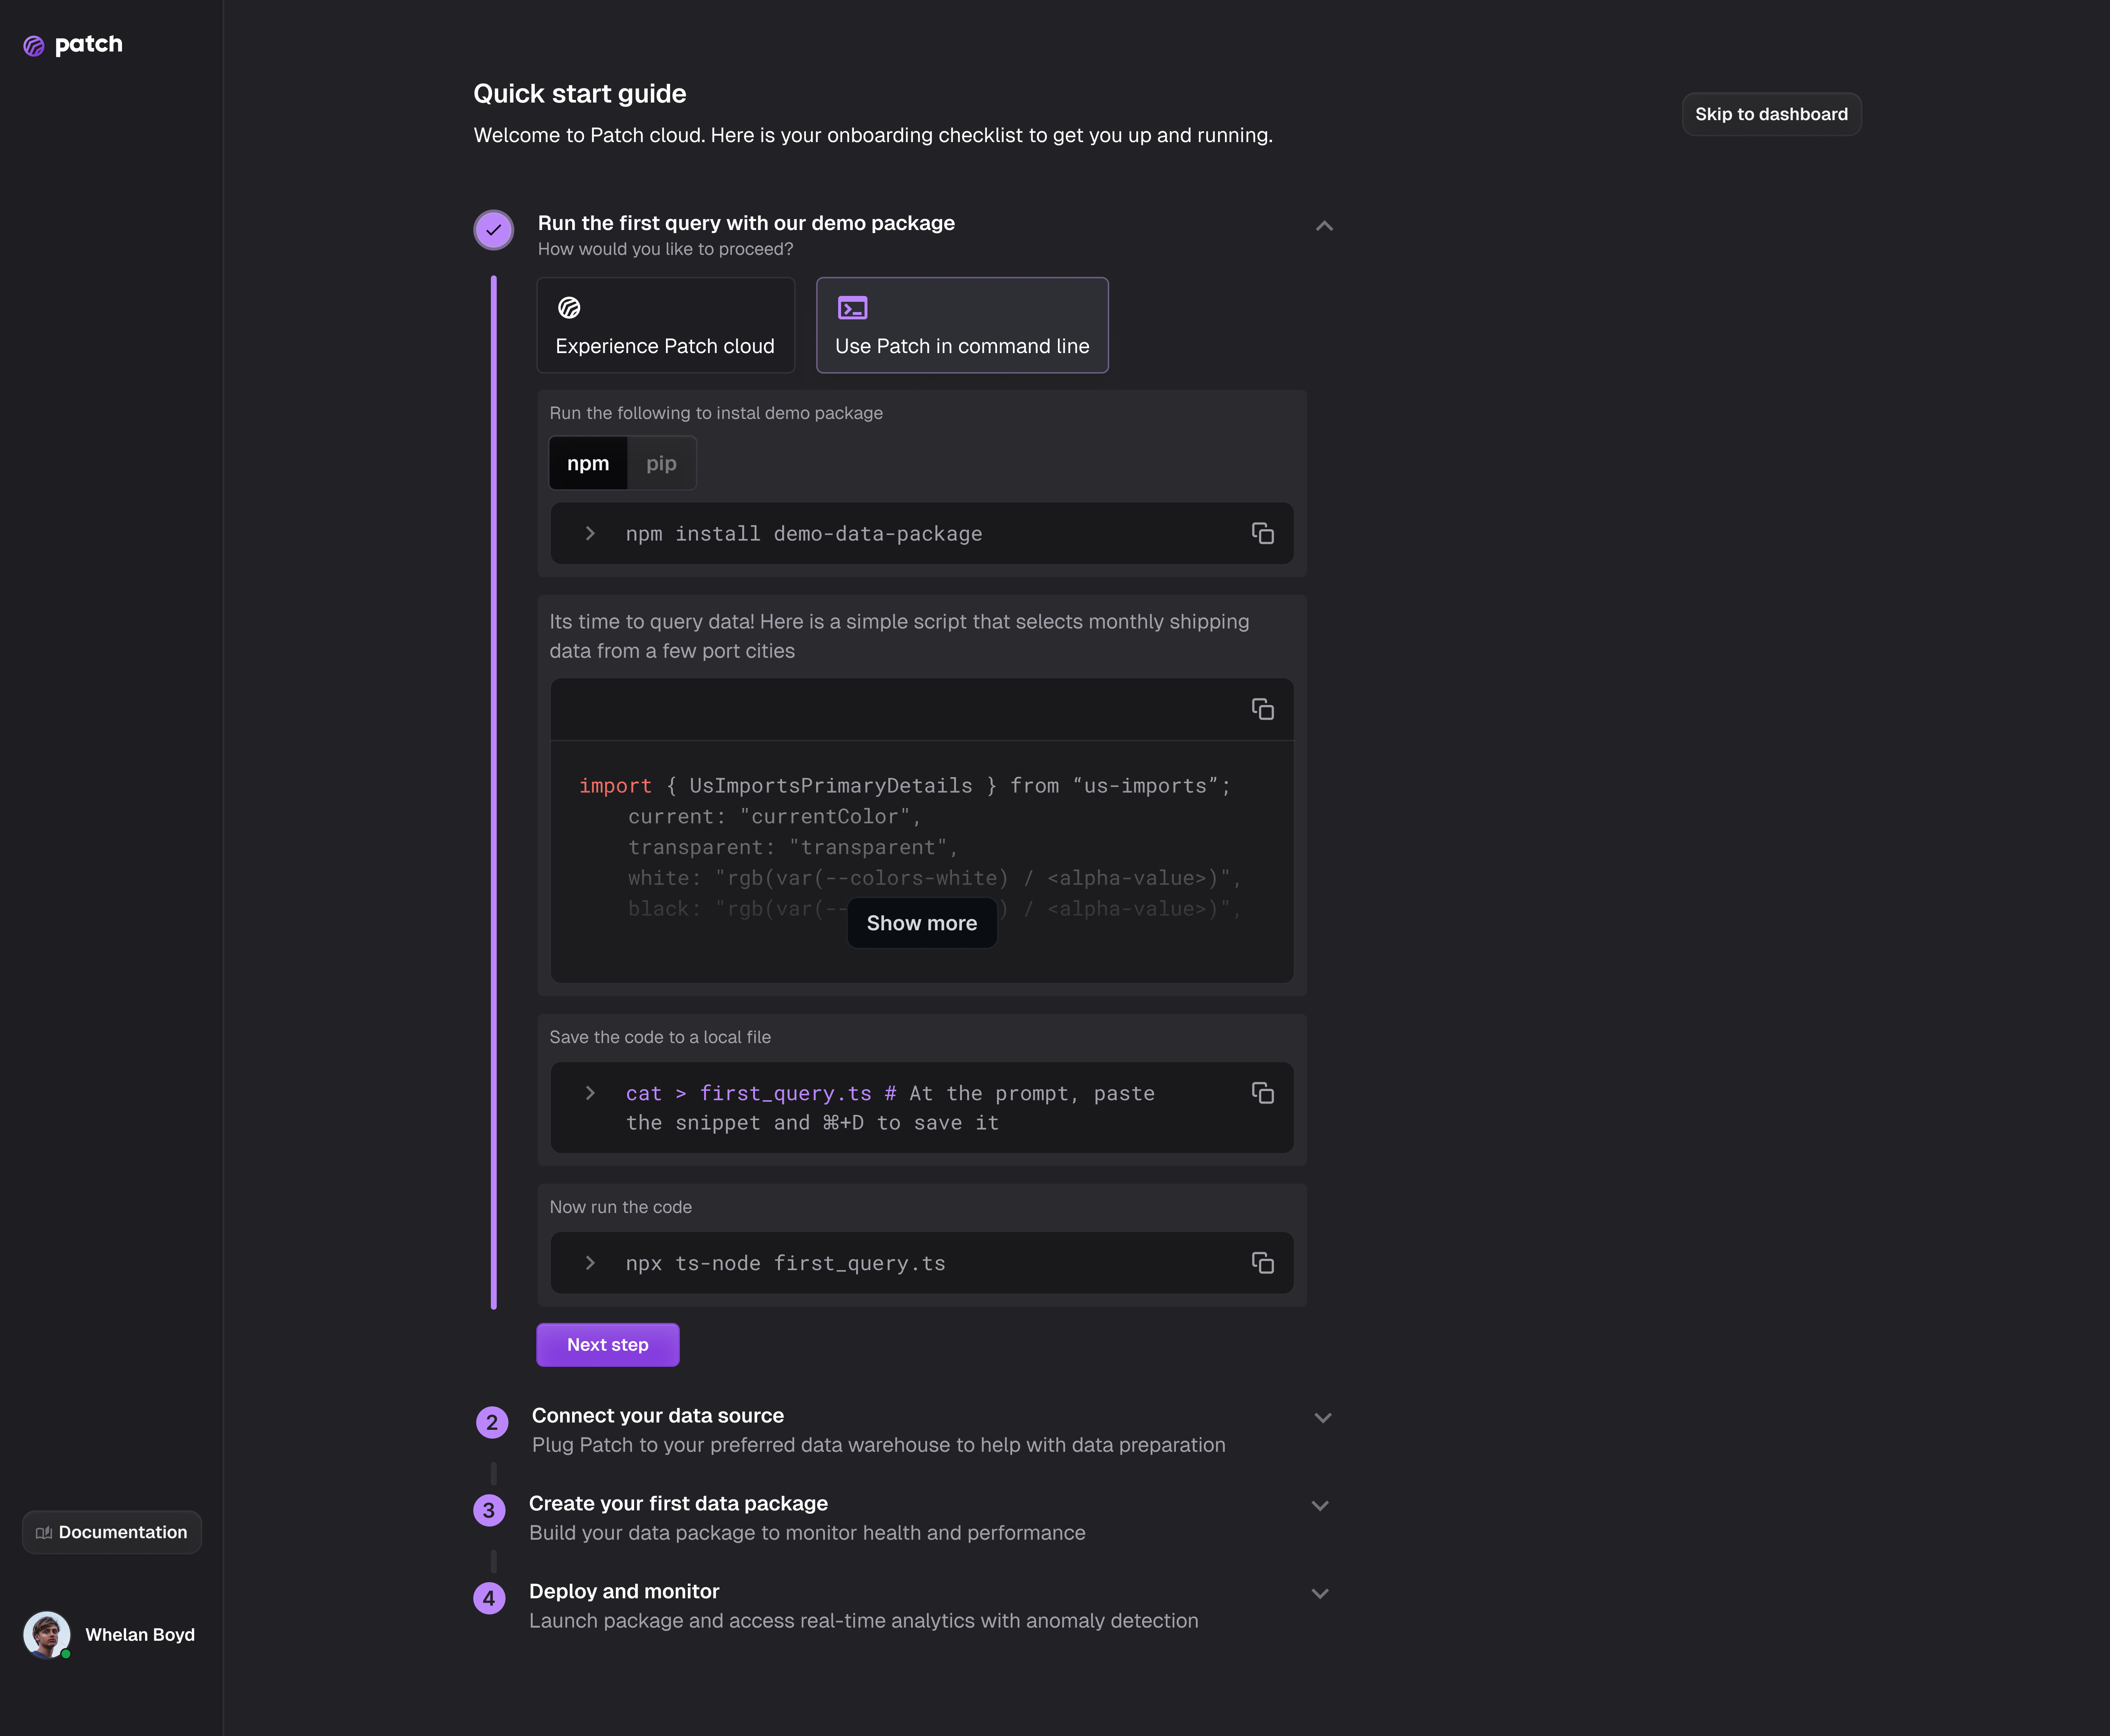

This project reinforced the importance of designing for both power users and those with limited technical expertise. By reducing complexity and surfacing actionable insights, we improved usability and adoption of Patch’s data platform.
More importantly, we were able to raise $3 Million in pre-seed and product was acquired after a year.